20+ years
45+
successful manufacturing projects
40+
happy manufacturing industry clients around the world
Custom Manufacturing Data Visualization Solutions
Our solutions transform manufacturing data into real-time insights and smarter decisions.
Real-time dashboards and KPIs for instant visibility into production performance
Historian and time-series analytics to optimize operations
SCADA, MES, and IoT integrations for unified data across all systems
Alerts, workflows, and collaboration to drive faster team response
Security, governance, and delivery to ensure compliant, reliable analytics
Expertise in Manufacturing Software Development
Manufacturing is complex, but we make it simpler. Our team develops custom manufacturing ERP software that streamlines processes, connects systems, and makes every stage of production more efficient.
Custom ERP Software
We develop tailored ERP systems that unify all your manufacturing operations, from inventory to production, finance and HR. Our solutions improve efficiency, reduce errors, and scale with your business needs.
Supply Chain Management Software
Take full command of your supply chain using intelligent software that streamlines operations from logistics to procurement. Our solutions minimize delays, lower costs, and strengthen collaboration with suppliers for smoother workflows.
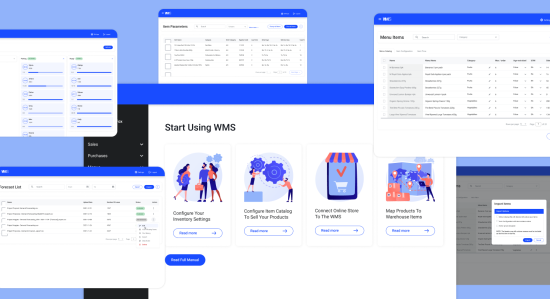
WMS Software
Our warehouse management systems streamline inventory tracking, order fulfillment, and storage optimization. With real-time data and automation, you’ll boost accuracy and reduce warehouse waste.
IoT-Powered Smart Manufacturing
We build intelligent shop floors by connecting devices into a unified, responsive system. With IoT-powered insights, manufacturers can anticipate issues, monitor operations in real time, and make smarter decisions that boost efficiency.
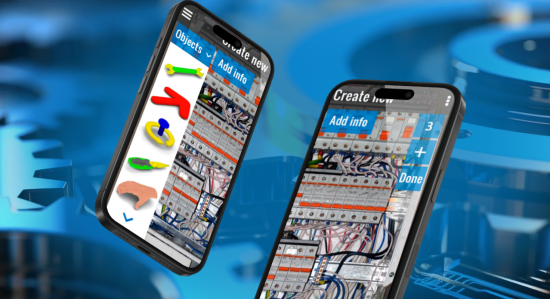
Effective Manufacturing Training
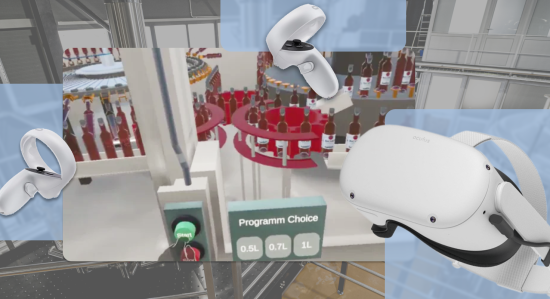
We create immersive training tools using Virtual Reality and digital simulations that allow employees to learn complex procedures safely and efficiently. They enable hands-on practice without disrupting production, putting equipment at risk, or compromising safety, with faster skill development.
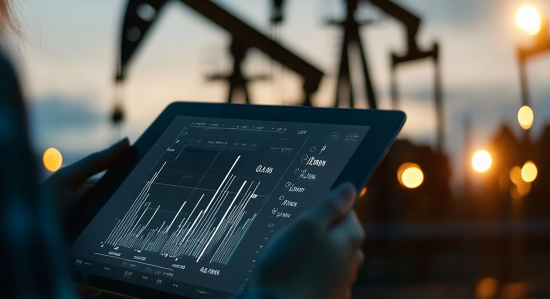
Manufacturing Data Visualization
Turn raw manufacturing data into meaningful insights that inspire better decisions. With intuitive dashboards and analytics, you’ll gain a clear view of operations and reveal opportunities to improve efficiency and strategy.
Customer Stories
Trusted by 40+ manufacturing providers to deliver life-changing digital solutions

Customer Reviews
See what our clients have to say about us
Key Features of Industrial Data Visualisation Software
These features turn complex manufacturing data into clear, actionable insights
-
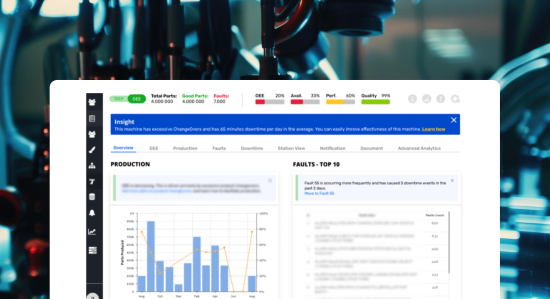
Real-Time Dashboards
Real-time dashboards provide a complete view of production and operations as they happen. Visual indicators make complex data easy to understand, helping teams spot bottlenecks, track KPIs, and make faster decisions.This is a core part of manufacturing data visualization.
-
Drill-Down Navigation and Floor Maps
Interactive floor maps and drill-down navigation reveal data from plant-level overviews down to individual machines. This approach makes it simple to locate issues and follow workflows. Teams can quickly see where problems are occurring and act with greater precision.
-
Historian and Time-Series Analytics
Historical and time-series data provides insight into trends over time. Analysts can detect gradual changes, uncover inefficiencies, and forecast performance. Combining historical context with real-time information allows teams to optimize their processes, reduce downtime, and improve overall manufacturing analytics.
-
Alerts and Anomaly Detection
Alerts and anomaly detection highlight deviations from normal operations. By identifying irregularities early, teams can prevent downtime, maintain quality standards, and ensure continuous production. Smart notifications reduce the need for constant manual monitoring and enhance data visualization services.
-
Data Integration and Modeling
Integrated data from SCADA, MES, IoT devices, and other sources creates a unified view of operations. Modeling tools consolidate this information to reveal patterns, identify correlations, and support informed decisions. This feature is key to data analytics and visualization services.
-
Self-Serve Analysis
Self-serve analysis gives employees the ability to explore data independently. Intuitive visual tools empower operators, engineers, and managers to generate insights without IT support. This encourages faster problem-solving, collaboration, and data-driven decisions across the organization.
-
Reporting and Sharing
Reporting and sharing make insights accessible across teams. Automated dashboards ensure alignment and collaboration, allowing stakeholders to interact with data. Clear, consistent reporting supports informed decisions and faster action, forming a key part of our data analytics and visualization services.
-
Security and Governance
Security and governance are vital parts of maintaining data integrity and compliance. Role-based access, audit tracking, and policy enforcement protect sensitive information while allowing teams to collaborate effectively. Reliable governance ensures trust in analytics without slowing down productivity or restricting operational visibility.
Technologies to Power Manufacturing Data Visualization
The technology foundation behind powerful, scalable manufacturing data visualization solutions
Time-Series Storage
Time-series databases capture high-frequency industrial data for precise analysis. They store sensor readings, equipment logs, and performance metrics over time. This foundation supports manufacturing analytics by making it possible to discover trends, carry out predictive modeling, and optimize processes across complex production environments.
Industrial Connectivity
Connectivity solutions link machines, sensors, and control systems into a unified data environment. Secure protocols ensure reliable data flow from SCADA, MES, and IoT devices. The result is seamless integration that supports real-time visibility and manufacturing data visualization.
Stream and Batch Processing
Real-time and historical data are both processed efficiently. Stream processing handles a continuous flow of data from sensors, while batch systems manage large datasets. Together, they make it possible to get fast insights, timely alerts, and scalable analytics for manufacturing operations of any size.
Visualization and Apps
Purpose-built visualization tools and applications transform complex data into clear dashboards. Teams can explore operations visually, track KPIs, and share insights instantly. These solutions form the core of professional data visualization services for modern manufacturers.
Analytics and Anomaly Detection
Machine Learning models and statistical algorithms uncover patterns and detect deviations in production behavior. Automated alerts highlight unusual activity before it becomes a critical situation, empowering proactive maintenance and smarter decision-making on the factory floor.
Cloud-Native DevSecOps
Cloud-native architectures combine scalability, automation, and built-in security. With continuous integration and deployment, analytics systems stay reliable and up to date. A DevSecOps approach ensures that every visualization and workflow remains compliant, efficient, and ready for industrial-scale performance.
Integration Possibilities for Data Visualization Solutions
Integration can transform isolated industrial systems into connected, data-driven operations
-
OT/PLC Connectivity
Operational Technology (OT) and Programmable Logic Controllers (PLCs) provide the foundation for real-time factory data. Connecting directly to machines enables a seamless flow of data for monitoring and control. This integration is essential for accurate manufacturing data visualization and performance tracking.
-
SCADA and Historians
Supervisory Control and Data Acquisition (SCADA) systems and data historians collect detailed process information. Integration of this data allows teams to visualize production metrics, analyze historical trends, and uncover inefficiencies. These connections form a key component of modern data visualization services.
-
MES and ERP
Manufacturing Execution Systems (MES) and Enterprise Resource Planning (ERP) platforms bridge production and business operations. Visualizing this data helps companies align supply, scheduling, and output. Through expert data visualization, organizations gain transparency from the shop floor to the boardroom.
-
IoT Platforms and Edge Devices
Internet of Things (IoT) platforms and edge devices stream live data from sensors and machines. Edge computing enables analytics on the local level and allows you to gain insights faster. This combination supports agile decision-making and empowers predictive manufacturing.
Why Choose Hymux Technologies for Industrial Data Visualization Services?
A trusted partner that combines technical skills with transparency and user-focused design.
OT-to-IT Expertise
Hymux Technologies bridges the gap between Operational Technology (OT) and Information Technology (IT). Our team understands how to connect machines, sensors, and industrial systems with enterprise software. This combined knowledge ensures that you’ll see smooth data flow, accurate analytics, and reliable manufacturing data visualization across all levels of production.
Transparent Delivery
Our clients gain full visibility into every project stage. We communicate openly, provide regular progress updates, and welcome feedback. This transparent process builds trust, reduces risks, and keeps delivery predictable. We focus on ensuring that every visualization solution aligns with your business goals and technical requirements.
UX That Drives Adoption
Data visualization succeeds only when people use it. We design intuitive interfaces and clear dashboards that make complex information easy to explore. This focus on user experience (UX) helps teams quickly adopt new tools, improving productivity and decision-making across your manufacturing operations.
Scalable, Modern Stack
Hymux Technologies uses a flexible and future-ready technology stack. Our solutions scale easily from pilot projects to enterprise-wide deployments. Built with modern tools and cloud technologies, they support real-time analytics, data visualization consulting, and seamless integration with evolving industrial ecosystems.
Easy Steps to a Strong Partnership
Starting with Hymux Technologies
Send project requirements
and a technical specification, if there is one
Get a personal proposal
and a project estimation
Start your project
with a team of manufacturing software experts
FAQs For Manufacturing Data Visualization Consultants
What Data Sources Can Be Integrated With Manufacturing Data Visualization Systems?
What BI Tools and Analytics Platforms Are Supported?
How Long Does an MVP Take, and What’s Included?
What KPIs Can We See (OEE, Downtime, Scrap, Throughput)?
What Training and Support Do You Provide After Going Live?
We are open to seeing your business needs and determining the best solution. Complete this form, and receive a free personalized proposal from your dedicated manager.

Sergei Vardomatski
Founder